The number on a bathroom scale tells you how much you weigh. It does not tell you what that weight is made of.
Two people can be the same height, weigh exactly 180 pounds, and have dramatically different physiques. One might carry considerably more skeletal muscle and less body fat, while the other has less muscle and more fat. Their BMI could even be identical, yet their body composition, physical appearance, and potentially their health profiles can be very different.
Body composition gives us a better way to understand what lies beneath total bodyweight. Measurements such as body-fat percentage, fat mass, fat-free mass, waist circumference, BMI, and FFMI each provide different pieces of information. None tells the complete story by itself.
The problem is that body-composition numbers often appear far more precise than they really are. A smart scale might report 16.7% body fat. A DEXA scan might produce another number, while skinfold calipers or a circumference formula produce something different again. That does not necessarily mean one method is correct and every other method is wrong.
FitCalc's approach is to use body-composition measurements as tools, not absolute scores. Understand what each measurement represents, recognize its limitations, use consistent methods when tracking change, and focus more on meaningful trends than tiny differences between individual readings.
This guide is educational context for adults, not a diagnosis or a target body-fat prescription. Children, pregnancy, major fluid changes and medical conditions need different assessment and interpretation. If weighing, photos or body-fat tracking increase anxiety or restrictive eating, step back from those measurements and get appropriate support. You do not need a body-fat percentage to benefit from nutritious food and regular activity.
What Body Composition Actually Means
Your body includes fat, water, protein, minerals and other components, organized into tissues such as skeletal muscle, bone and organs. These are different ways of describing the same body: water is already present inside muscle and organs, so those categories should not be added together as if they were separate compartments.
Body-composition models simplify that complexity into categories that are easier to measure and understand. One of the most common is the two-compartment model, which divides body mass into fat mass and fat-free mass.
This model is useful, but the terminology can create confusion. Fat-free mass is not another name for muscle. A DXA report separates lean soft tissue from bone mineral; neither term is identical to skeletal muscle. The five-level model of body composition explains why molecular components and tissues should not be treated as interchangeable categories.
Understanding those distinctions first makes every other body-composition measurement easier to interpret.
Bodyweight, Fat Mass and Fat-Free Mass
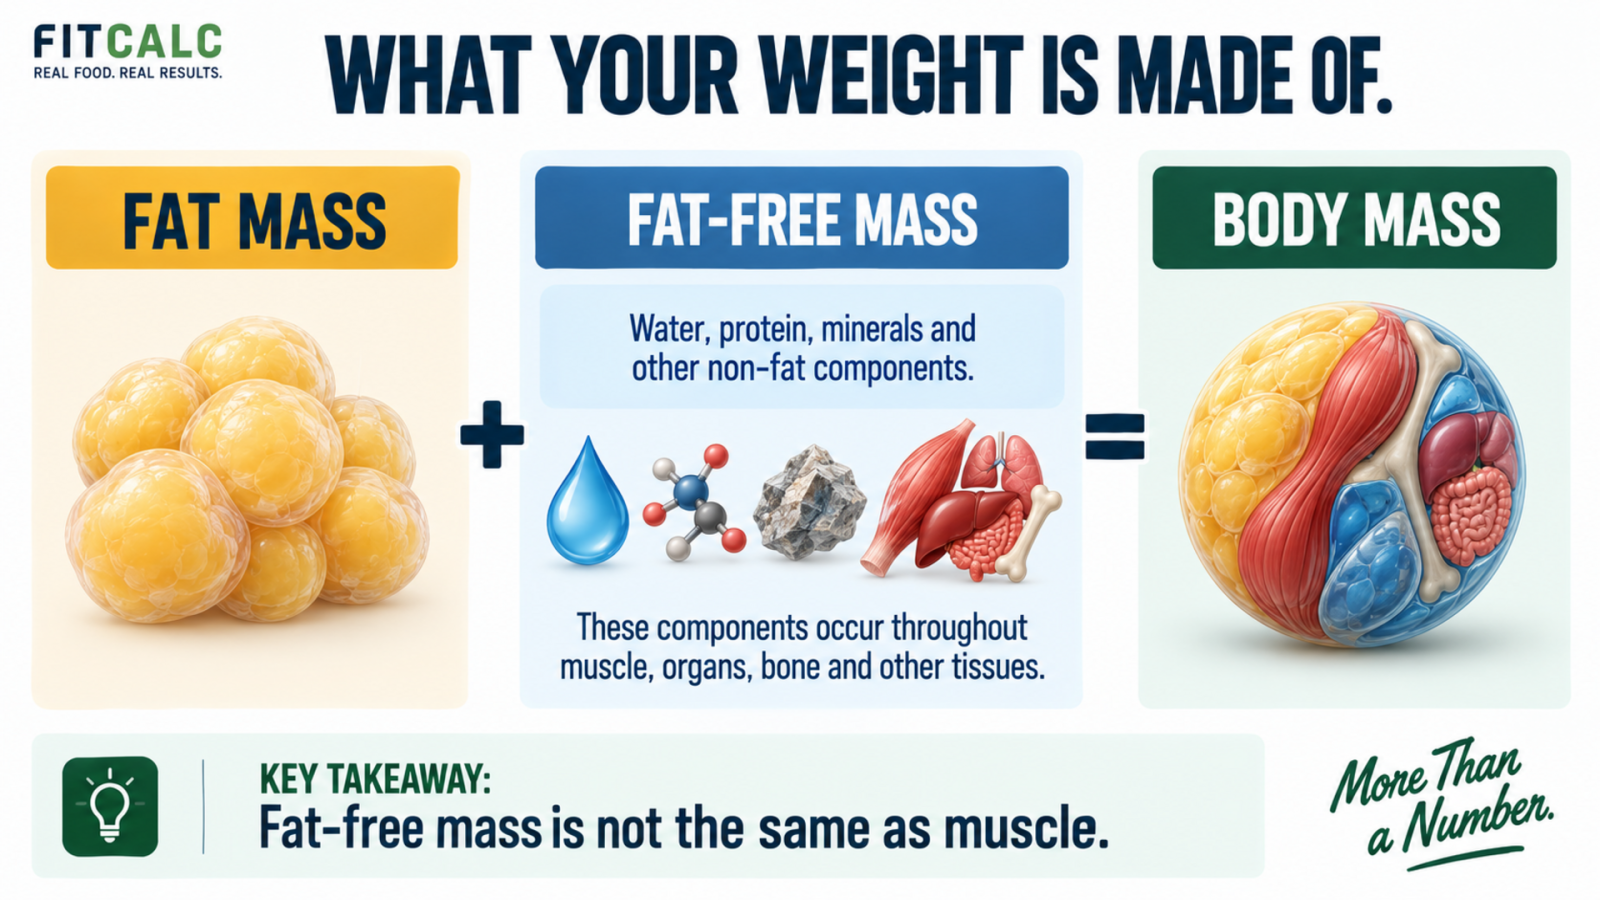
In the usual two-compartment model, fat mass means the body’s fat component. It is not the same as the full weight of adipose tissue: adipose tissue also contains water, protein and other non-fat material.
Fat-free mass (FFM) is the mass remaining after fat mass is subtracted from total body mass. It includes water, protein, minerals and other non-fat components distributed throughout the body, including the non-fat portions of muscle, organs and bone.
This distinction matters when a report shows an increase in “lean mass.” The number does not establish that the same amount of skeletal muscle was built. In a study of 18 trained male cyclists, changing glycogen and creatine stores changed DXA lean-mass estimates over a period in which little change in muscle protein was expected. That study illustrates the measurement issue, not the size of a typical person’s fluctuation. Bone et al., 2017
Skeletal muscle is therefore part of your fat-free mass, but it is not the entirety of it.
Imagine someone weighs 180 pounds and is estimated to carry 36 pounds of fat mass. Under a basic two-compartment model, the remaining 144 pounds would be fat-free mass. That does not mean the person has 144 pounds of muscle. Their bones, organs, water, connective tissue, and other non-fat components are included in that number.
This also helps explain why bodyweight can change without meaningful changes in either body fat or skeletal muscle. Eating a high-carbohydrate meal can increase glycogen and associated water. Changes in sodium intake can alter fluid retention. The amount of food moving through the digestive system changes throughout the day. None of these necessarily represents new fat or muscle tissue.
For physique goals, the long-term objective is usually more specific than simply changing scale weight. Someone losing weight generally wants most of that loss to come from excess fat while preserving muscle. Someone gaining weight for muscle growth wants a meaningful portion of that gain to represent new lean tissue rather than simply accumulating body fat.
Understanding Body-Fat Percentage
Body-fat percentage expresses estimated fat mass as a percentage of total bodyweight.
If a 180-pound person is estimated to be 20% body fat, the calculation gives approximately 36 pounds of fat mass. Subtracting that from total bodyweight leaves approximately 144 pounds of fat-free mass.
For a hypothetical follow-up at 170 pounds and an estimated 15% body fat, the arithmetic gives 25.5 pounds of fat mass and 144.5 pounds of fat-free mass. Compared with the first example, that is 10.5 pounds less estimated fat and 0.5 pounds more estimated fat-free mass, for a net 10-pound weight loss. These are calculations from assumed percentages, not proof that a real measurement detected a half-pound lean-tissue gain.
If reliable measurements supported that pattern over time, it would suggest substantial fat loss with broadly maintained fat-free mass. The arithmetic alone cannot verify the underlying estimates.
Body-fat percentage can also improve without losing weight. Someone who builds muscle while losing fat may remain near the same total bodyweight while becoming noticeably leaner. Likewise, someone deliberately gaining muscle could increase scale weight while maintaining a similar body-fat percentage.
The difficulty is measuring body-fat percentage accurately. Unlike bodyweight, which can be measured directly with a good scale, body-fat percentage is usually estimated from another measurement or model. DEXA, bioelectrical impedance, skinfolds, circumference equations, and other techniques all make assumptions and contain sources of error.
This is why FitCalc does not recommend becoming attached to decimal-level precision. If your smart scale reports 17.4% body fat, you should generally think of that as an estimate rather than proof that exactly 17.4% of your body is fat.
A more useful question is often whether the trend is moving in the expected direction under reasonably consistent measurement conditions. We will examine the strengths and weaknesses of the major testing methods later in this guide.
Why Body Composition Matters More Than Scale Weight Alone
Scale weight remains useful. The mistake is expecting it to answer questions it was never designed to answer.
As an illustrative comparison, suppose two men are both 6 feet tall and weigh 190 pounds. One is estimated at 12% body fat, while the other is estimated at 25%. These percentages are examples, not recommended targets.
At 12%, estimated fat mass would be approximately 22.8 pounds, leaving about 167.2 pounds of fat-free mass. At 25%, estimated fat mass would be approximately 47.5 pounds, leaving approximately 142.5 pounds of fat-free mass.
The scale sees two 190-pound people. Body composition reveals very different distributions of that weight.

This distinction is particularly important when evaluating progress. A person who begins resistance training may gain muscle while simultaneously losing some fat, especially if they are relatively new to training. Scale weight may change slowly even while their physique improves substantially.
The reverse can happen during poorly structured weight loss. Someone may celebrate rapid scale loss without realizing that a meaningful portion of the lost weight is lean tissue. The scale moved in the desired direction, but the body-composition outcome was less favorable.
That does not mean lower body fat is always better or that everyone should pursue extreme leanness. A physique goal should not override health, adequate fueling, normal function or a healthy relationship with food. The Australian Institute of Sport’s assessment guidance emphasizes physical and emotional well-being and cautions against overemphasizing body composition as a performance factor.
The main lesson is simpler: bodyweight tells you how heavy you are; body composition helps explain what that weight consists of.
From there, measurements such as BMI, waist circumference, and FFMI can add additional context, provided we understand what each one can and cannot tell us.
BMI, Waist Circumference and FFMI
Body-fat percentage gives useful information about the estimated proportion of fat and fat-free mass in your body, but it is not the only way to evaluate body size or composition. Some of the most useful measurements require nothing more than height, weight, and a tape measure.
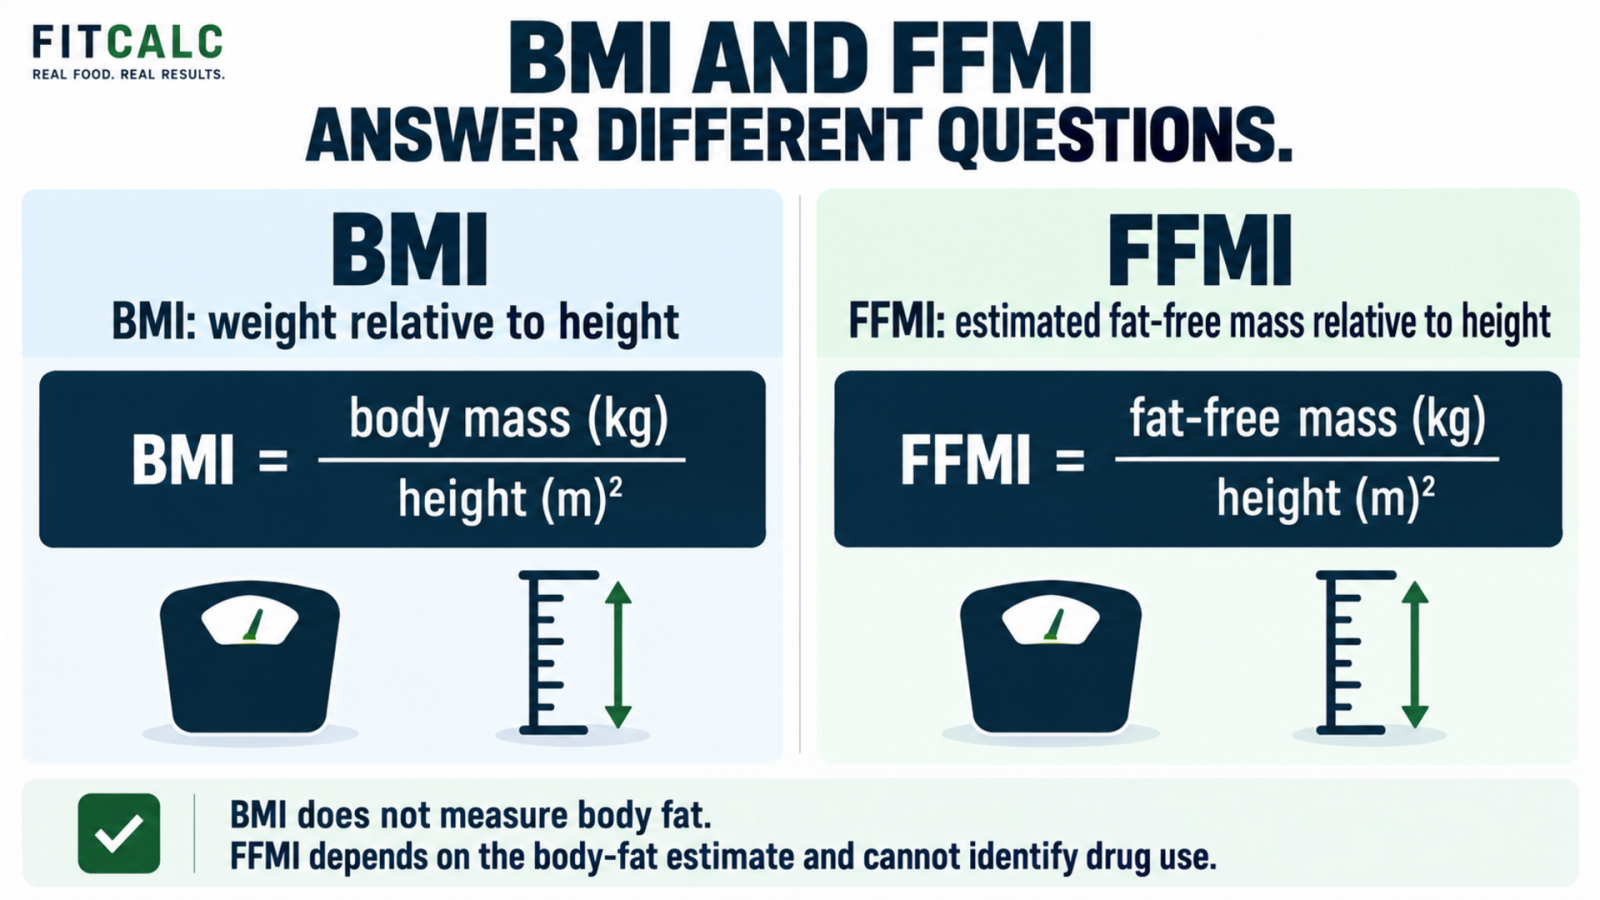
BMI, waist circumference, and FFMI each answer a different question. BMI describes bodyweight relative to height. Waist circumference adds information about central fat distribution. FFMI uses estimated fat-free mass to put muscularity into the context of height.
None should be used as a standalone judgment of someone's health or physique. Used together and interpreted correctly, however, they can provide much more context than scale weight alone.
What BMI Tells You and What It Doesn't
Body mass index (BMI) is calculated by dividing bodyweight in kilograms by height in meters squared. It is simple, inexpensive, and requires no specialized equipment, which is a major reason it has become one of the most widely used body-size measurements.
For adults aged 20 or older, CDC uses the following BMI screening categories. Children and teenagers require age- and sex-specific interpretation. CDC adult BMI categories
A BMI below 18.5 is in the underweight category; 18.5 to less than 25 is in the healthy-weight category; 25 to less than 30 is in the overweight category; and 30 or higher is in the obesity category. These are screening labels, not a complete description of someone’s health.
These categories can be useful for broad screening and population research, but BMI has an obvious limitation: it has no idea what your bodyweight is made of.
Consider a 6-foot, 210-pound resistance-trained man carrying substantial muscle. His BMI is approximately 28.5, placing him in the conventional overweight category. Another 6-foot, 210-pound man with substantially less muscle and more body fat receives exactly the same BMI.
The equation sees only height and weight.
That does not make BMI useless. It is a practical screening tool, but it cannot identify fat distribution or distinguish fat from muscle and bone. A clinician interprets it alongside history, examination and other health measures. CDC guidance on BMI
NICE recommends adding waist-to-height ratio when assessing central adiposity in adults with BMI below 35, including people with high muscle mass. Health-risk interpretation also depends on factors such as age and ethnicity; one BMI category is not a complete individual assessment. NICE assessment guidance
FitCalc therefore takes a middle position. We do not dismiss BMI simply because it has limitations, but we also do not believe a muscular person should automatically conclude that they have excess body fat because a BMI calculator labels them "overweight."
Context matters.
If someone has a BMI of 28, a large waist circumference, little muscle, and other indicators of excess adiposity, the BMI result provides useful supporting information. If another person has the same BMI, a much smaller waist, substantial muscular development, and a relatively low body-fat estimate, the number means something different.

Waist Circumference and Fat Distribution
Two people can carry the same amount of body fat while storing it differently. That distribution matters.
More abdominal fat, including visceral fat around internal organs, can be relevant to cardiometabolic risk. Waist circumference adds information about abdominal size, but does not directly measure visceral fat or diagnose a health condition.
This makes waist measurement useful even for someone who already knows their bodyweight.
Imagine two people with identical BMI values. One has a substantially larger waist circumference relative to their height, while the other carries more muscle and considerably less abdominal fat. BMI cannot distinguish between them, but waist circumference provides another useful piece of the picture.
Measurement technique matters. If you measure at a different location every week, pull the tape dramatically tighter one time than another, or alternate between measuring after a large meal and first thing in the morning, small changes become difficult to interpret.
Choose and record a repeatable measurement protocol. NICE’s self-measurement method places the tape midway between the bottom of the ribs and the top of the hips and takes the reading after a natural breath out. Keep the tape level and snug without compressing the skin. Use the same location and similar conditions each time; follow the relevant clinical protocol when comparing a measurement with published thresholds. NICE waist-measurement instructions
Waist circumference can be particularly valuable during both fat loss and muscle gain. During a successful fat-loss phase, a gradually shrinking waist can confirm progress even when scale weight temporarily stalls because of water fluctuations. During a muscle-gaining phase, a rapidly expanding waist alongside fast scale gain may suggest that the calorie surplus is producing more body-fat accumulation than intended.
The measurement is inexpensive, takes seconds, and does not pretend to calculate your body-fat percentage to a decimal place. That simplicity is one of its strengths.
The waist-to-height ratio calculator can put a waist measurement in the context of height. Treat the result as screening information, not a diagnosis.
FFMI and Measuring Muscularity
BMI puts total bodyweight into the context of height. Fat-free mass index (FFMI) applies a similar idea specifically to estimated fat-free mass.
The basic equation is:
FFMI = fat-free mass in kilograms ÷ height in meters²
Suppose a 6-foot person weighs 180 pounds at an estimated 15% body fat. Their estimated fat mass is 27 pounds, leaving approximately 153 pounds of fat-free mass.
Converted to metric units, 153 pounds is approximately 69.40 kilograms, and 6 feet is 1.8288 meters. Keeping that conversion precision:
69.40 ÷ 1.8288² ≈ 20.8 FFMI (rounded to one decimal place)
FFMI gives us information that BMI cannot. If two people are the same height but one carries substantially more fat-free mass, FFMI helps quantify that difference without the fat mass contributing directly to the score.
This can add context for resistance-trained people, but FFMI describes estimated fat-free mass relative to height, not pure skeletal muscle. FitCalc reports standard, unadjusted FFMI. Some other calculators also show a height-adjusted FFMI. Do not compare adjusted and unadjusted values as if they were identical. The original study used an adjustment to a reference height of 1.80 m. Kouri et al., 1995
FFMI still inherits an important weakness: it depends on the accuracy of the body-fat estimate used to calculate fat-free mass. If your actual body-fat percentage differs meaningfully from the estimate, your calculated FFMI will differ as well.
This is another reason not to become obsessed with tiny differences. An FFMI of 21.1 versus 21.4 does not necessarily represent a meaningful change in muscularity if the underlying body-fat estimates contain measurement error.
The internet has popularized an FFMI of 25 as a hard drug-free limit. That interpretation goes beyond the evidence. The 1995 paper studied 157 male athletes, including 74 reported nonusers of anabolic steroids, and described its findings as preliminary. Later research in 209 male collegiate athletes across 10 sports reported higher height-adjusted values and sport differences. Neither sample establishes a universal biological ceiling or lets you determine an individual’s drug use from FFMI. Kouri et al., 1995; Currier et al., 2019
Body build, height, training history, assessment method and the comparison population all affect interpretation. These male-athlete studies should not be turned into universal standards for women, older adults or the general population.
FitCalc therefore views FFMI as a useful muscularity metric, not a score you need to maximize and not a drug-use detector.
BMI, waist circumference, and FFMI work best when they are allowed to answer the questions they were designed for. BMI gives broad body-size context. Waist circumference provides information about central adiposity. FFMI helps describe muscularity relative to height.
None directly measures every component of your body. To estimate those components more closely, we have to turn to methods such as DEXA, bioelectrical impedance, skinfolds, and other body-composition assessments, each of which introduces its own advantages and limitations.
How Body Composition Is Measured
Body composition cannot be measured as easily as bodyweight. A scale can directly measure how much force your body exerts on it and convert that into a weight reading. Determining how much of that weight is fat, lean tissue, bone, or water requires additional measurements and assumptions.
This is why different body-composition methods can produce different results for the same person. DEXA, bioelectrical impedance, skinfold calipers, and circumference-based methods do not simply look at the body in different ways and reveal the same hidden number. They measure different properties and then use models to estimate body compartments.
FitCalc does not believe everyone needs the most advanced testing method available. The usefulness of a body-composition measurement depends partly on what you want to learn and whether you can repeat the measurement consistently enough to track meaningful change.
DEXA Scans
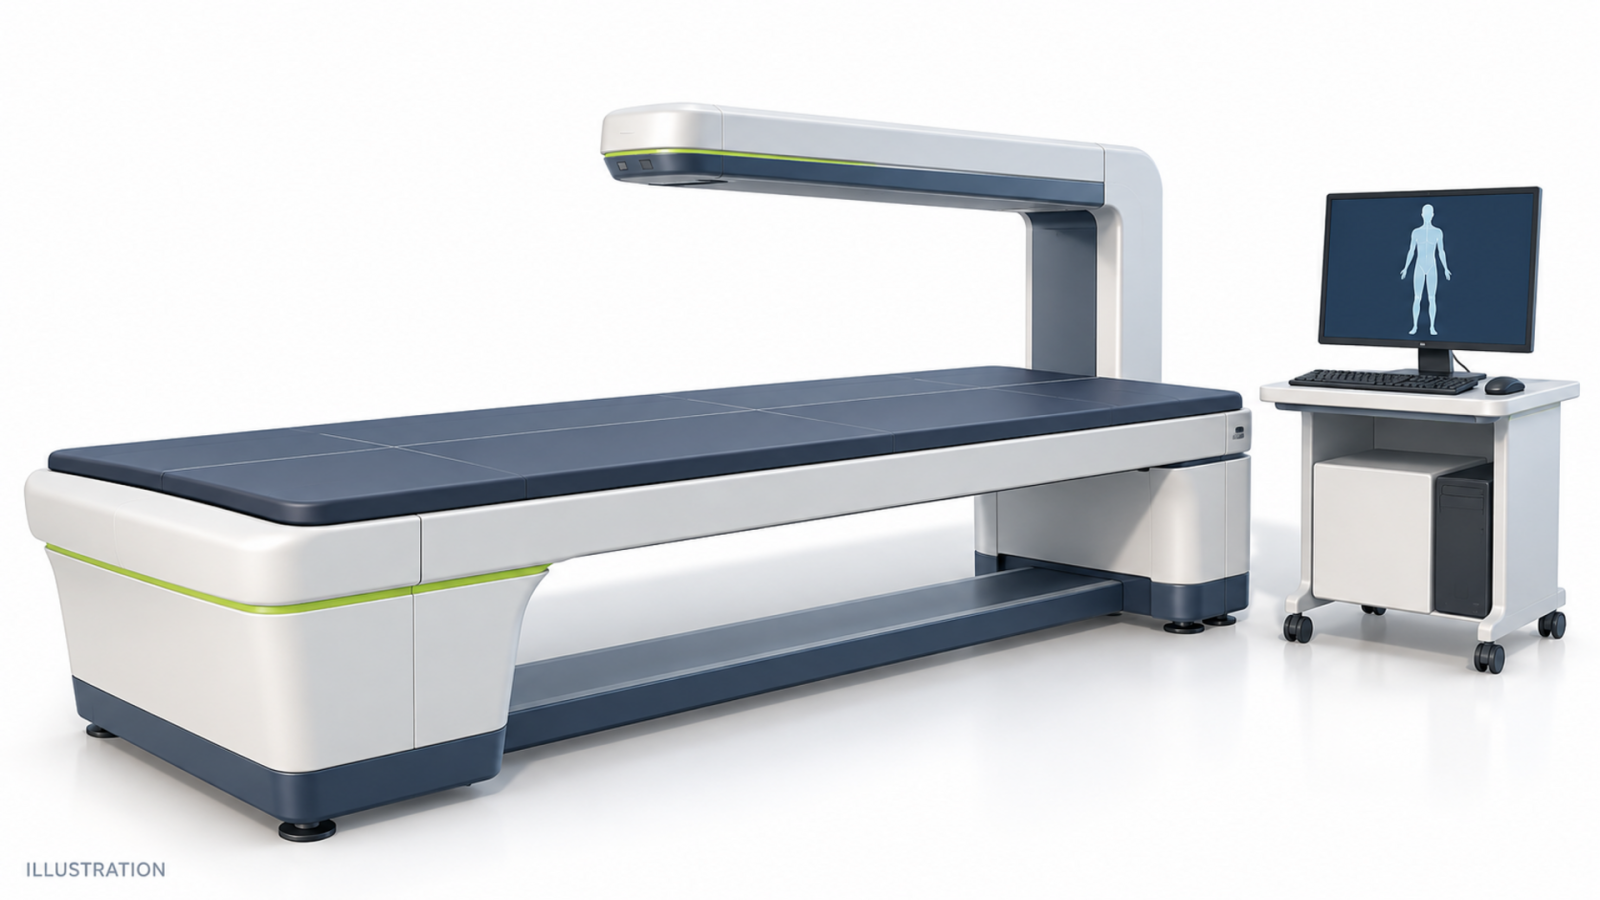
Dual-energy X-ray absorptiometry (DEXA or DXA) is one of the more sophisticated and widely recognized methods used to assess body composition. Originally developed primarily for assessing bone mineral density, modern DEXA systems can also estimate regional and whole-body fat mass and lean soft tissue.
During a scan, very low-dose X-rays at different energy levels pass through the body. Because bone mineral, lean soft tissue, and fat attenuate those X-rays differently, software can estimate the distribution of those compartments.
This produces much more information than a bathroom scale. A DEXA report may provide estimates of total fat mass, body-fat percentage, lean soft tissue, bone mineral content, and regional differences between areas such as the arms, legs, and trunk.
That sophistication can make the result feel absolute. It isn't.
DXA still relies on calibration, analysis and testing protocols. The ISCD official positions warn that measurements from different manufacturers can have systematic differences and require technologists to assess precision. A small change between scans may be measurement variation rather than a real tissue change.
Food intake, recent activity and positioning can affect the result. In 31 active young adults, daily activities and breakfast changed DXA lean-mass estimates and their variability. Standardized scanning conditions improved interpretation. Nana et al., 2012
This becomes especially important when someone is trying to determine whether they gained a very small amount of muscle. If a DEXA report shows two additional pounds of lean soft tissue after a short training period, it would be too confident to declare that exactly two pounds of new skeletal muscle were built.
The scan did not directly remove and weigh the person's muscles. It estimated body compartments.

DEXA can still be extremely useful. It provides detailed regional information, includes bone measurements, and can offer a strong body-composition reference when performed and interpreted appropriately. FitCalc simply recommends treating it as a sophisticated estimate rather than unquestionable truth.
If you repeat DEXA scans, using the same facility and machine under similar hydration, feeding, exercise, and timing conditions makes the comparison considerably more meaningful.
Follow the testing facility’s preparation instructions, and ask whether a reported change exceeds that facility’s measurement uncertainty. DXA body-composition scanning is contraindicated during pregnancy according to ISCD. A whole-body composition report also does not replace a clinically indicated diagnostic bone-density assessment. ISCD body-composition positions
For a closer look at what a report can and cannot establish, read FitCalc’s guide to DEXA scans.
BIA, Smart Scales and Skinfolds
The most accessible body-fat estimate for many people comes from bioelectrical impedance analysis (BIA). This technology appears in bathroom smart scales, handheld devices, and more elaborate multi-electrode machines found in gyms and clinics.
BIA sends a small electrical current through the body and measures opposition to that current. Because body fluids containing electrolytes conduct electricity differently from tissues containing relatively little water, the device can use impedance alongside variables such as height, weight, age, and sex to estimate total body water and body composition.
That means your smart scale is not directly detecting and weighing your body fat.
It is measuring electrical properties and feeding those measurements into a prediction model.
Because BIA predicts composition partly from electrical properties related to body water, changing measurement conditions can change the result. Device-specific prediction equations and the population in which they were developed also matter. Follow the device instructions; consistent timing is sensible but does not guarantee accuracy.
A smart scale can still be useful for weighing yourself. In a hospital-based study of three consumer scales, bodyweight measurements were much closer to DXA than the body-composition estimates were. That study did not establish that those scales could accurately track fat change over months, and it did not test every device. Frija-Masson et al., 2021
A drop from 17.8% to 17.2% is a change of 0.6 percentage points in the displayed estimate. It is not proof of that exact change in actual body fat. Check whether waist, weight and other observations support the same interpretation.
Skinfold testing takes a different approach. Calipers measure the thickness of folds of skin and underlying subcutaneous fat at standardized anatomical sites. Those measurements can then be entered into equations that estimate body density and body-fat percentage.
Skinfold tracking depends on the measurement sites, tester and protocol. Keep the same trained tester and method where possible. The AIS assessment guidance describes surface measurements, including skinfolds, as useful for tracking change in athletes; converting them to an exact whole-body fat percentage adds another prediction step.
For personal tracking, the same experienced tester using the same protocol is preferable to having several people use different techniques.
The broader FitCalc principle is that consistency can improve comparability, but cannot remove systematic error or make an unvalidated method accurate.
Suppose a BIA estimate gradually falls while weight and waist measurements also decline over several months. That pattern may support a fat-loss interpretation, but the BIA reading should remain secondary evidence. Its estimated fat percentage and FFMI are not independent confirmations, because both may be calculated from the same inputs.
Switching halfway through from BIA to skinfolds and comparing the two numbers directly would be much less informative.
Tape Measurements, Photos and the Mirror
You do not necessarily need a body-fat percentage to determine whether your body composition is improving.
Some of the most practical tracking tools are also the simplest.
Waist circumference is particularly useful because it can reveal changes in abdominal size while requiring nothing more than a tape measure. Other circumference measurements, such as the arms, thighs, chest, hips, or shoulders, can provide additional information depending on your goal.
The interpretation depends on context. During fat loss, decreasing bodyweight and waist circumference while muscular measurements and gym performance remain relatively stable can suggest a favorable change in composition. During a muscle-gaining phase, gradual increases in bodyweight and muscular measurements with only modest waist growth can suggest a different but equally useful pattern.
Progress photographs add information that numbers cannot fully capture. Photos taken under similar lighting, distance, posture, clothing, and time-of-day conditions can reveal changes in muscularity, shape, and fat distribution that may be difficult to notice in the mirror from one day to the next.
The mirror itself is useful too, but memory is not. When you see your body every day, gradual changes become difficult to recognize. A photograph from six months earlier provides a much better comparison than trying to remember what you looked like.
Scale weight remains part of this picture rather than something to discard. If bodyweight falls by 20 pounds, waist circumference drops substantially, photographs show increased definition, and gym strength is largely maintained, those measurements together tell a convincing story even without knowing whether body fat is exactly 14% or 16%.
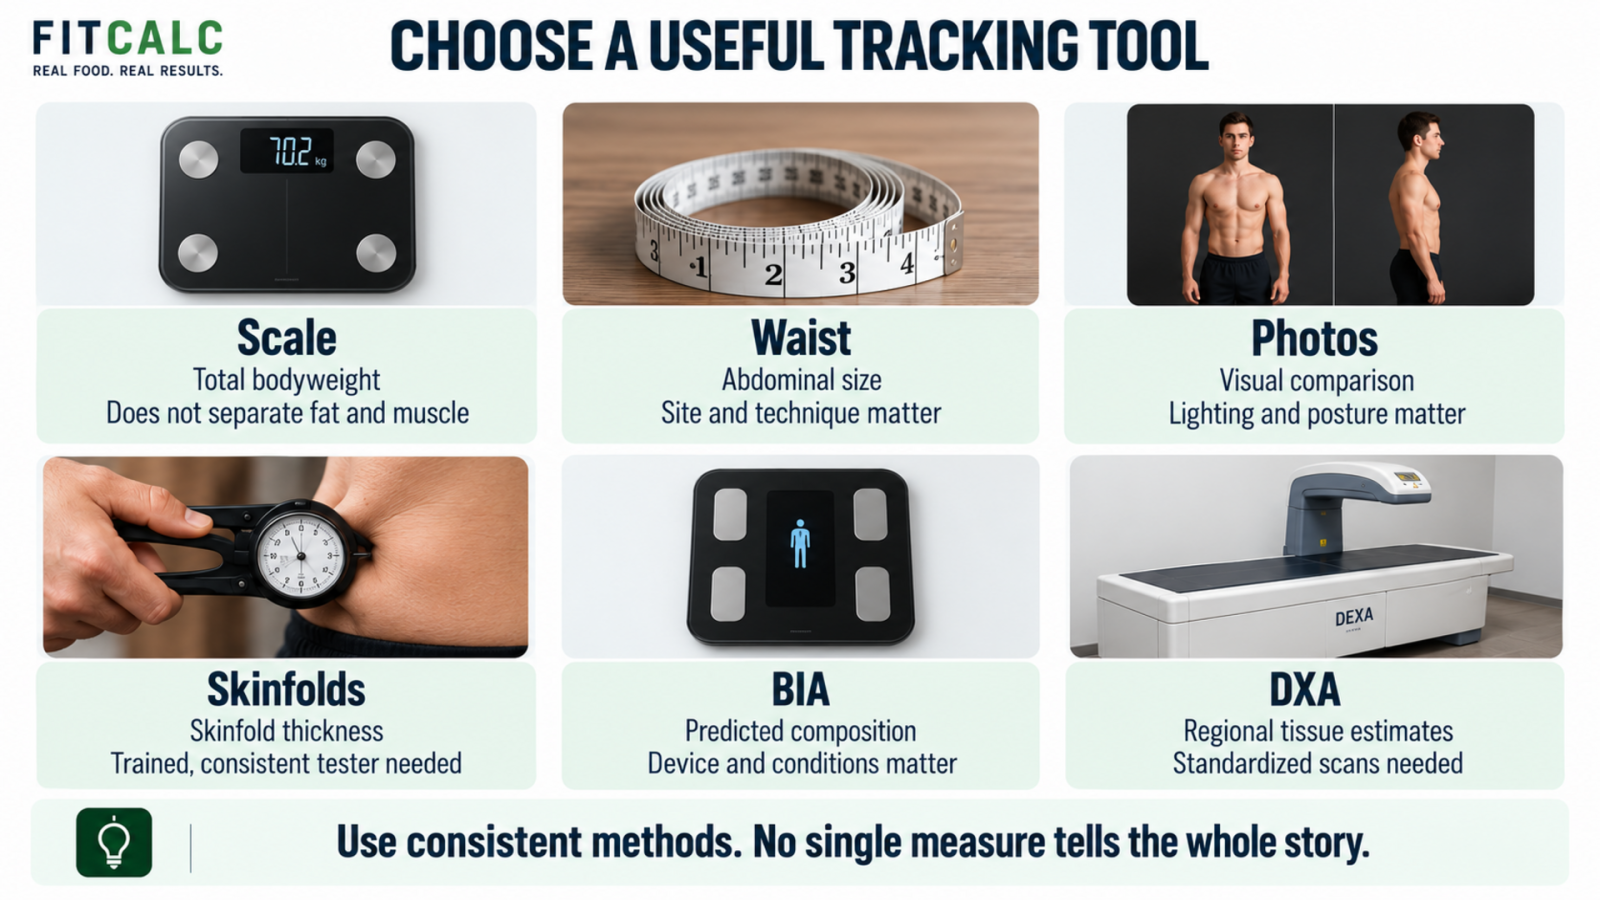
This is the main reason FitCalc does not recommend chasing increasingly expensive tests simply because they produce more numbers. The best tracking system is one that provides enough useful information to make decisions and can be repeated consistently.
For many people, bodyweight, waist circumference, progress photographs, and gym performance already provide an excellent foundation. A body-fat estimate or occasional DEXA scan can add context when desired, but it does not replace those basic trends.
Body-composition tracking becomes most useful when several complementary observations begin telling the same story.
How to Interpret and Track Your Results
Body-composition measurements become useful when they help you make better decisions. They become less useful when the goal shifts from understanding progress to chasing increasingly precise numbers.
Someone can know their morning bodyweight, BMI, waist circumference, smart-scale body-fat percentage, estimated fat mass, fat-free mass, and FFMI and still misunderstand what is happening to their body. More measurements do not automatically create more useful information.
FitCalc's approach is to use a small collection of complementary measurements and follow their trends over time. Bodyweight provides one part of the picture. Waist circumference adds another. Body-fat estimates and FFMI can provide additional context, while photographs and gym performance help show changes that equations cannot capture.
When several of those measurements move together in a logical direction, you can be much more confident about what is actually happening.
Stop Chasing Perfect Body-Fat Numbers
Body-fat percentage is useful partly because it turns an abstract idea such as "getting leaner" into something that can be estimated and tracked. The problem begins when an estimate is treated as an exact measurement.
Suppose a smart scale reports 15.2% body fat. The decimal makes the result appear extremely precise, but the device has not directly measured every gram of fat in your body. As discussed earlier, BIA estimates body composition from electrical impedance and prediction equations, while hydration and other testing conditions can influence the result.
The same principle applies even to more sophisticated methods. DEXA provides substantially more information than a bathroom smart scale, but a result of 14.8% should still not be interpreted as proof that exactly 14.8% of your body mass is fat.
Think of body-fat numbers as estimates with method- and person-dependent uncertainty. Do not invent a narrow range such as 15–17% simply because several devices return nearby values. Similar readings do not establish the true value or a valid confidence interval.
This becomes particularly important when comparing different methods. Someone might receive a 17% estimate from BIA, 14% from skinfolds, and 16% from DEXA. Trying to determine which number represents the one true percentage can become less useful than simply selecting an appropriate method and tracking it consistently.
A study comparing multiple techniques in 28 healthy adults found that agreement varied by method. This is one reason switching methods can create apparent changes that are not actual fat loss or muscle gain. Those findings support caution, not a single error margin that applies to every modern device. Fuller et al., 1992
If your consistent measurement method moves from approximately 22% toward 18% over several months while your waist shrinks, photographs show increased definition, and bodyweight falls, that trend tells a much stronger story than whether the final estimate is technically 17.5%, 18%, or 19%.
Greater decimal precision does not necessarily mean greater accuracy.
What Changes Should You Actually Look For?
The measurements that matter depend partly on your goal.
During fat loss, FitCalc wants to see the overall evidence pointing toward less fat while preserving as much lean tissue and physical performance as reasonably possible. Average bodyweight should generally trend downward over time. Waist circumference should usually decrease. Progress photographs should gradually show greater definition or reduced body size, while resistance-training performance should ideally remain reasonably strong.
A body-fat estimate moving downward can support that conclusion, but it does not need to move perfectly every week.
During a muscle-gaining phase, the pattern changes. Bodyweight should gradually increase, muscular measurements and gym performance should improve, and photographs should eventually show greater muscular development. Some fat gain may occur during a calorie surplus, but rapidly increasing waist circumference alongside very fast scale gain can suggest that the surplus is larger than necessary.
Body recomposition creates a third pattern. Someone may remain close to the same scale weight while their waist decreases, muscular measurements increase, training performance improves, and photographs show a leaner, more muscular physique. If you looked only at scale weight, you might incorrectly conclude that nothing happened.
The important question is whether several complementary observations support the same long-term conclusion.
To turn these observations into a plan, use the weight-loss guide for reducing excess fat or the muscle-building guide for training and nutrition. Changes in strength alone do not quantify muscle gain, and a smaller waist alone does not quantify pounds of fat lost.
The FitCalc Body-Composition Framework
You do not need every body-composition measurement available.
For most people, bodyweight provides an excellent starting point because it is inexpensive, easy to measure frequently, and useful for identifying longer-term changes in total mass. Waist circumference adds information that scale weight cannot, particularly regarding changes around the abdomen.
Body-fat percentage can provide additional context when measured consistently, but FitCalc treats it as an estimate. FFMI can be useful for someone interested in muscular development because it places estimated fat-free mass in the context of height. Neither needs to be checked constantly.
Progress photographs are particularly valuable because they show the physical outcome that many people actually care about. Strength and gym performance add another dimension by showing whether physical capability is improving or being maintained.
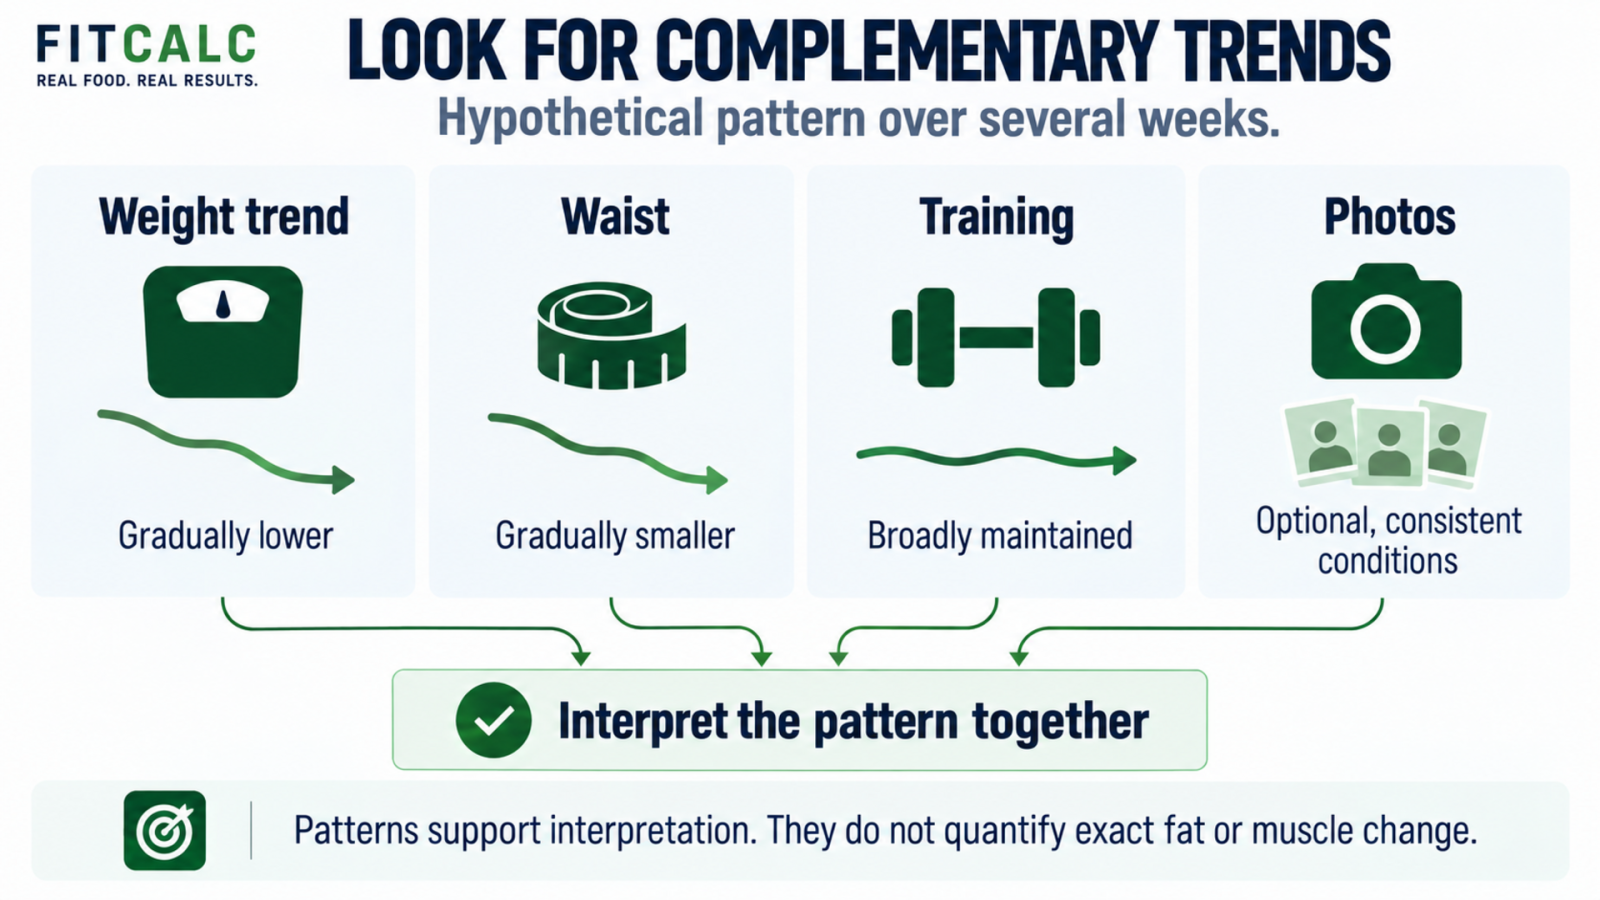
The best tracking system is therefore not necessarily the one containing the most technology. Someone using a normal scale, tape measure, consistent photographs, and training log may have enough information to make excellent decisions.
If you add BIA or periodic DEXA measurements, treat them as additional evidence rather than replacing everything else.
Most importantly, compare measurements with your own previous measurements. Your smart-scale body-fat percentage does not need to match someone else's DEXA result. Your FFMI does not need to compete with a number posted by a professional bodybuilder. Your BMI category does not tell you what your physique should look like.
The purpose of tracking is to determine whether your body is moving toward your goal.
Pick the least intrusive tracking routine that helps you make decisions. For example, review a weight trend and a consistently measured waist over several weeks, record training performance, and use optional photos less often. This is a practical workflow, not a requirement to weigh or photograph yourself every day.
Practical Takeaways
Bodyweight is useful, but it does not tell you what that weight consists of. Fat mass and fat-free mass provide additional context, while body-fat percentage expresses estimated fat mass relative to total bodyweight.
BMI remains a useful screening measurement, but it cannot distinguish muscle from fat. Waist circumference can add information about central adiposity, while FFMI helps place estimated muscularity in the context of height.
Body-composition testing should always be interpreted with its limitations in mind. DEXA is sophisticated but not infallible. BIA and smart-scale composition estimates need cautious interpretation; consistent use does not guarantee accurate fat-change tracking. Skinfold measurements depend heavily on technique. Tape measurements and progress photographs are simple but can be extremely useful when performed consistently.
FitCalc's main recommendation is to focus on trends rather than decimals. Use the same methods under similar conditions, and look for several measurements telling the same story.
Conclusion
Body composition is more complicated than a single number, but tracking it does not need to be complicated.
The scale tells you your total bodyweight. BMI places that weight in the context of height. Waist circumference provides information about abdominal size. Body-fat estimates attempt to separate fat from the rest of your mass. FFMI adds context about fat-free mass relative to height. Photographs and performance show changes that equations cannot fully capture.
Each tool answers a different question.
The mistake is expecting any one of them to provide a complete description of your body or health. A BMI category cannot tell whether a high bodyweight comes partly from substantial muscle. A DEXA scan cannot tell you exactly how much contractile muscle you built down to the ounce. A smart scale displaying 14.7% body fat does not make that decimal unquestionably true.
FitCalc would rather have several simple, consistent measurements pointing in the same direction than one supposedly perfect measurement taken in isolation.
Measure enough to understand what is happening. Keep the conditions consistent. Compare yourself with your previous results. Then use those trends to decide whether your nutrition and training are moving you toward the body composition you actually want.
That is ultimately what these numbers are for.
Sources
CDC. About Body Mass Index (BMI).
NICE NG246. Identifying and assessing overweight, obesity and central adiposity.
Kouri et al. (1995). Fat-free mass index in users and nonusers of anabolic-androgenic steroids.
Currier et al. (2019). Fat-Free Mass Index in a Diverse Sample of Male Collegiate Athletes.
International Society for Clinical Densitometry (2023). Official Adult Positions: Body Composition.
Australian Institute of Sport. Best Practice Protocols for DXA assessment of body composition.